A run, in full.
A value creation diagnostic taken end to end on a composite universal bank, shown through the platform itself. Each stage below explains what Frontara does, then shows the screen the user works in.
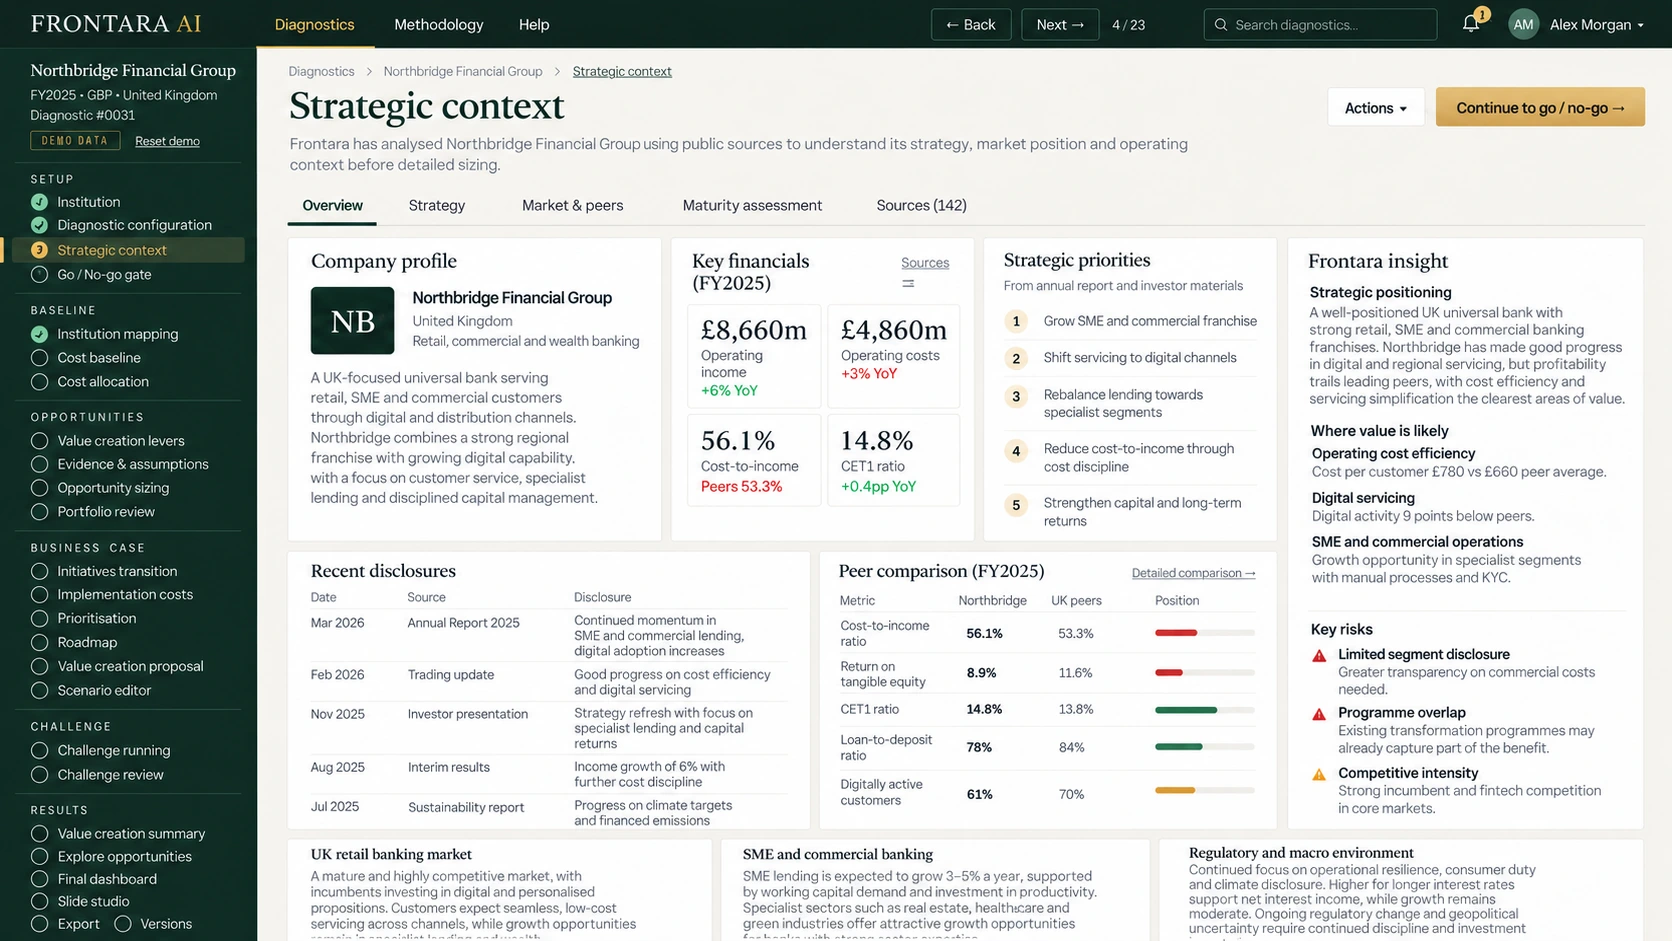
Who they are, and what they have already committed to.
Before any number is sized, Frontara reads the institution from the public record: what it earns, what it spends, how it is structured, and which peers it is judged against.
It then captures what the institution has told the market it will do — cost-to-income targets, branch undertakings, programmes already announced — because those commitments constrain what can honestly be proposed. A lever that conflicts with a public undertaking is excluded on that basis, not on its economics.
A maturity read across AI adoption, digital coverage, process automation and shared capability sets the starting line. The same lever is worth more in an institution that has barely begun than in one three years in.
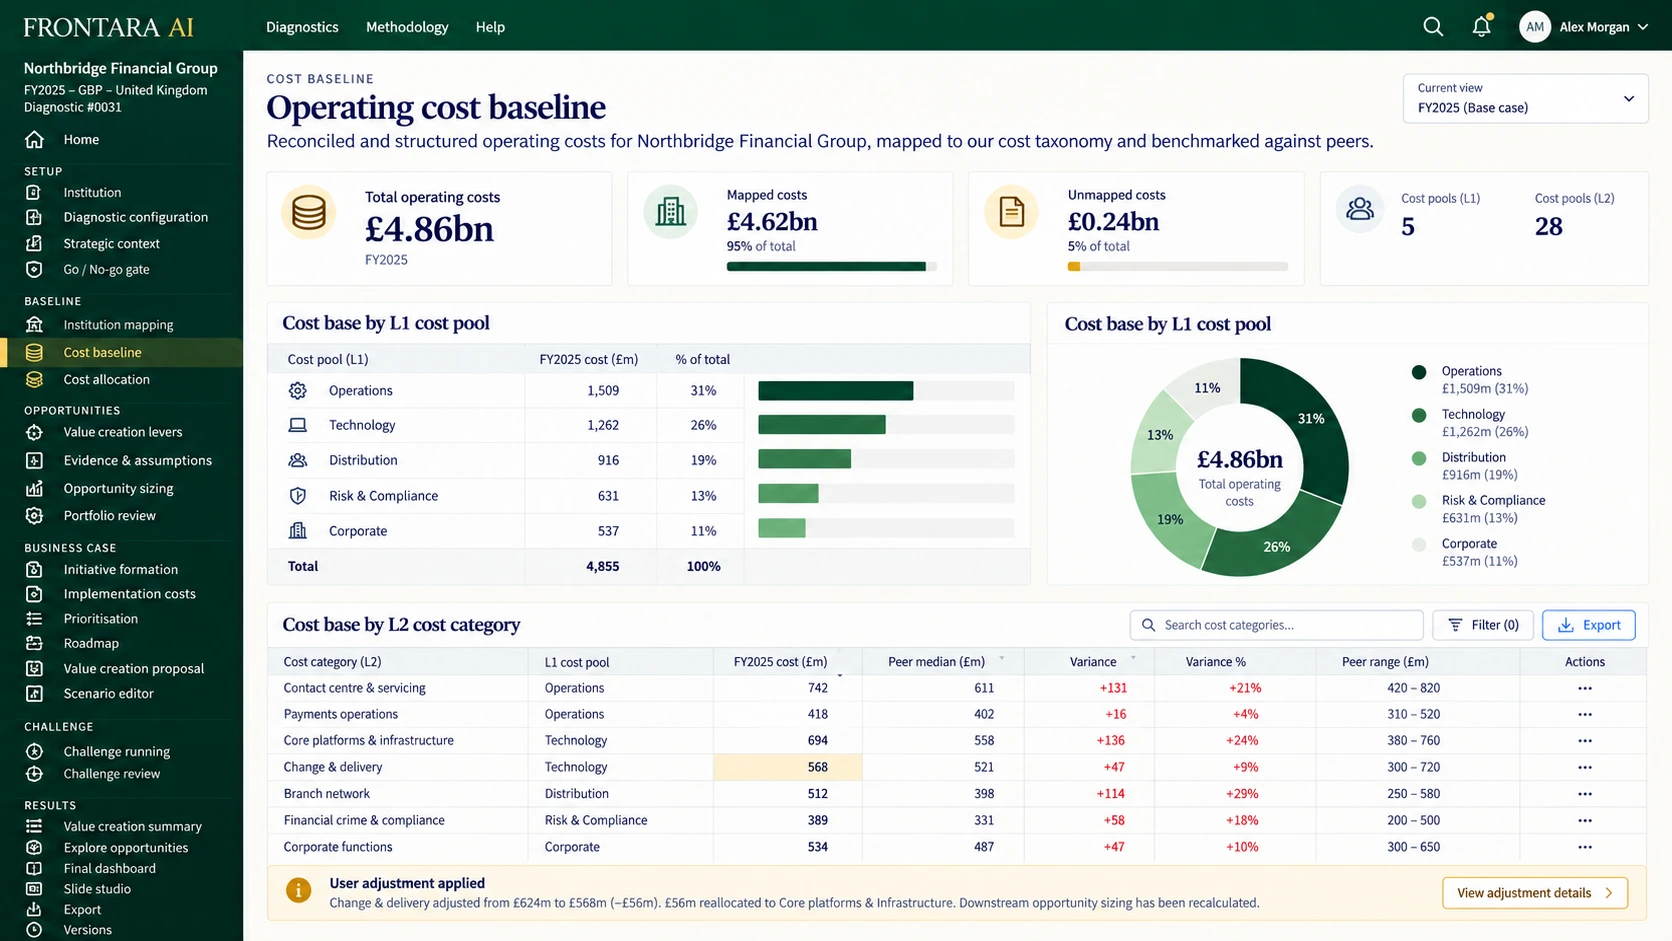
The cost base, deconstructed and checked against peers.
Reported operating costs are mapped into the canonical cost taxonomy, allocated across L1 and L2 pools using segment disclosures and peer ratios, then benchmarked pool by pool so the reader can see where cost sits high or low against comparable institutions.
What could not be mapped is left visible rather than absorbed. Every allocation stays open to challenge, and the user confirms or adjusts the baseline before anything is sized — a checkpoint the diagnostic cannot move past on its own.
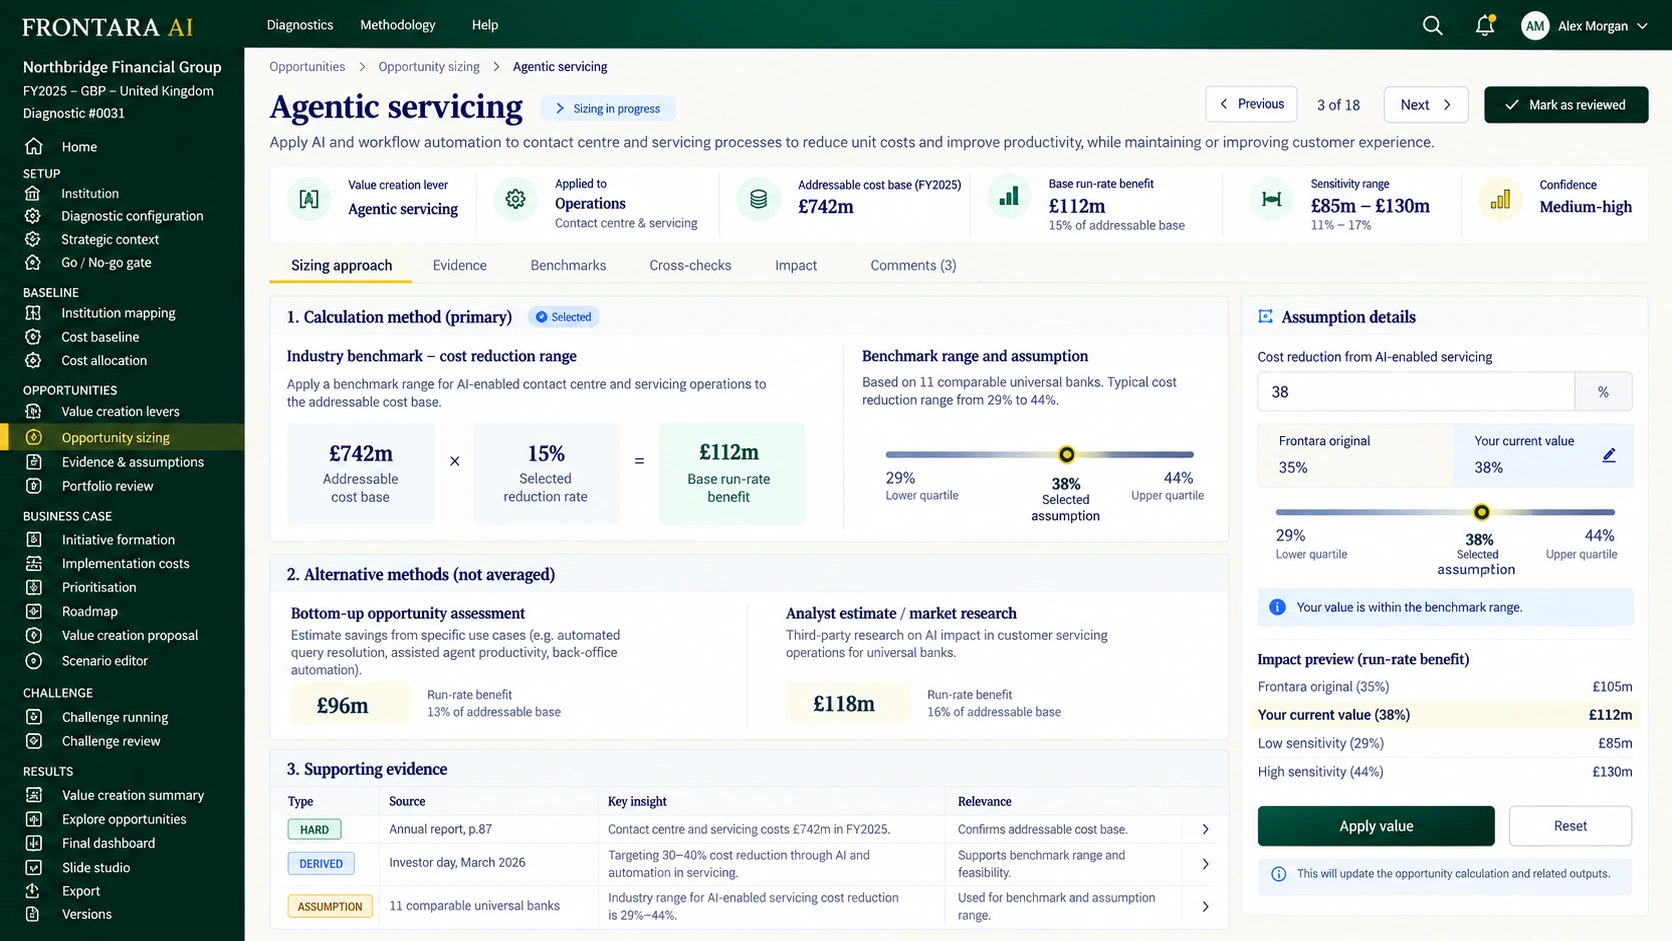
Every number keeps its working.
Frontara assesses the full lever library against the institution and its cost base, sizes what applies, and records what it rejected. Overlapping levers are not both counted; benefit already booked against an announced programme is not counted twice.
Each opportunity opens to show the addressable base, the calculation method chosen, the alternative methods considered and not averaged, the evidence behind every input at its tier — reported, derived or assumed — and the sensitivity range around the assumption.
The assumption itself remains the user’s to move. Change it and the sizing, the roadmap and the returns recalculate behind it.
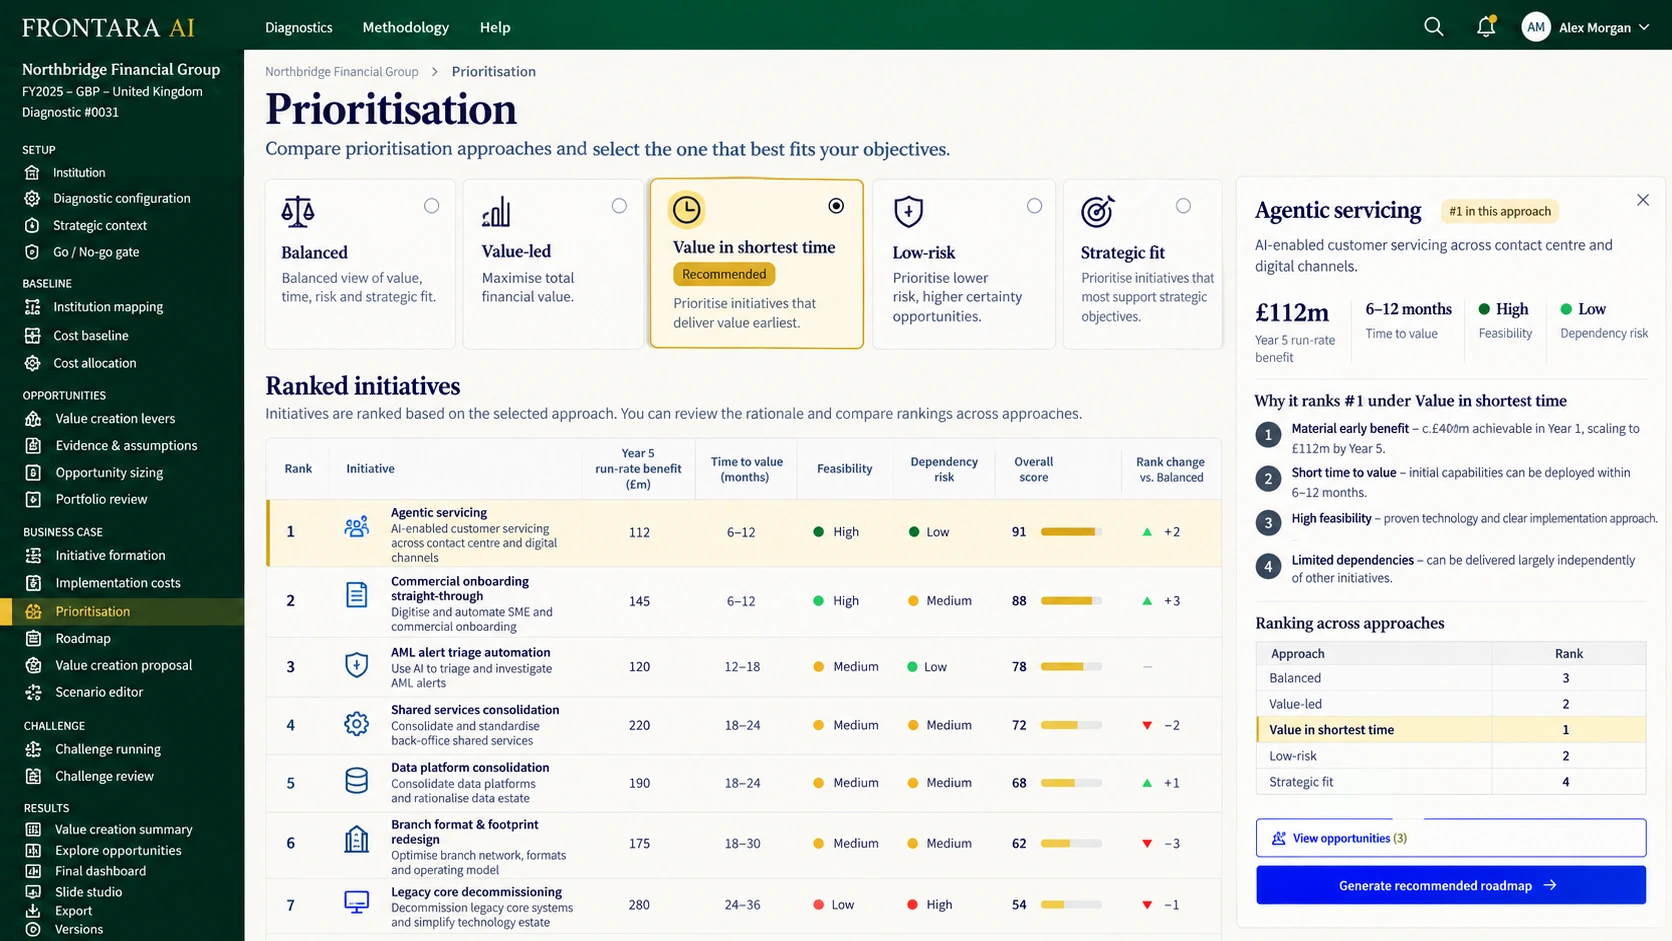
The sequence follows the decision you make.
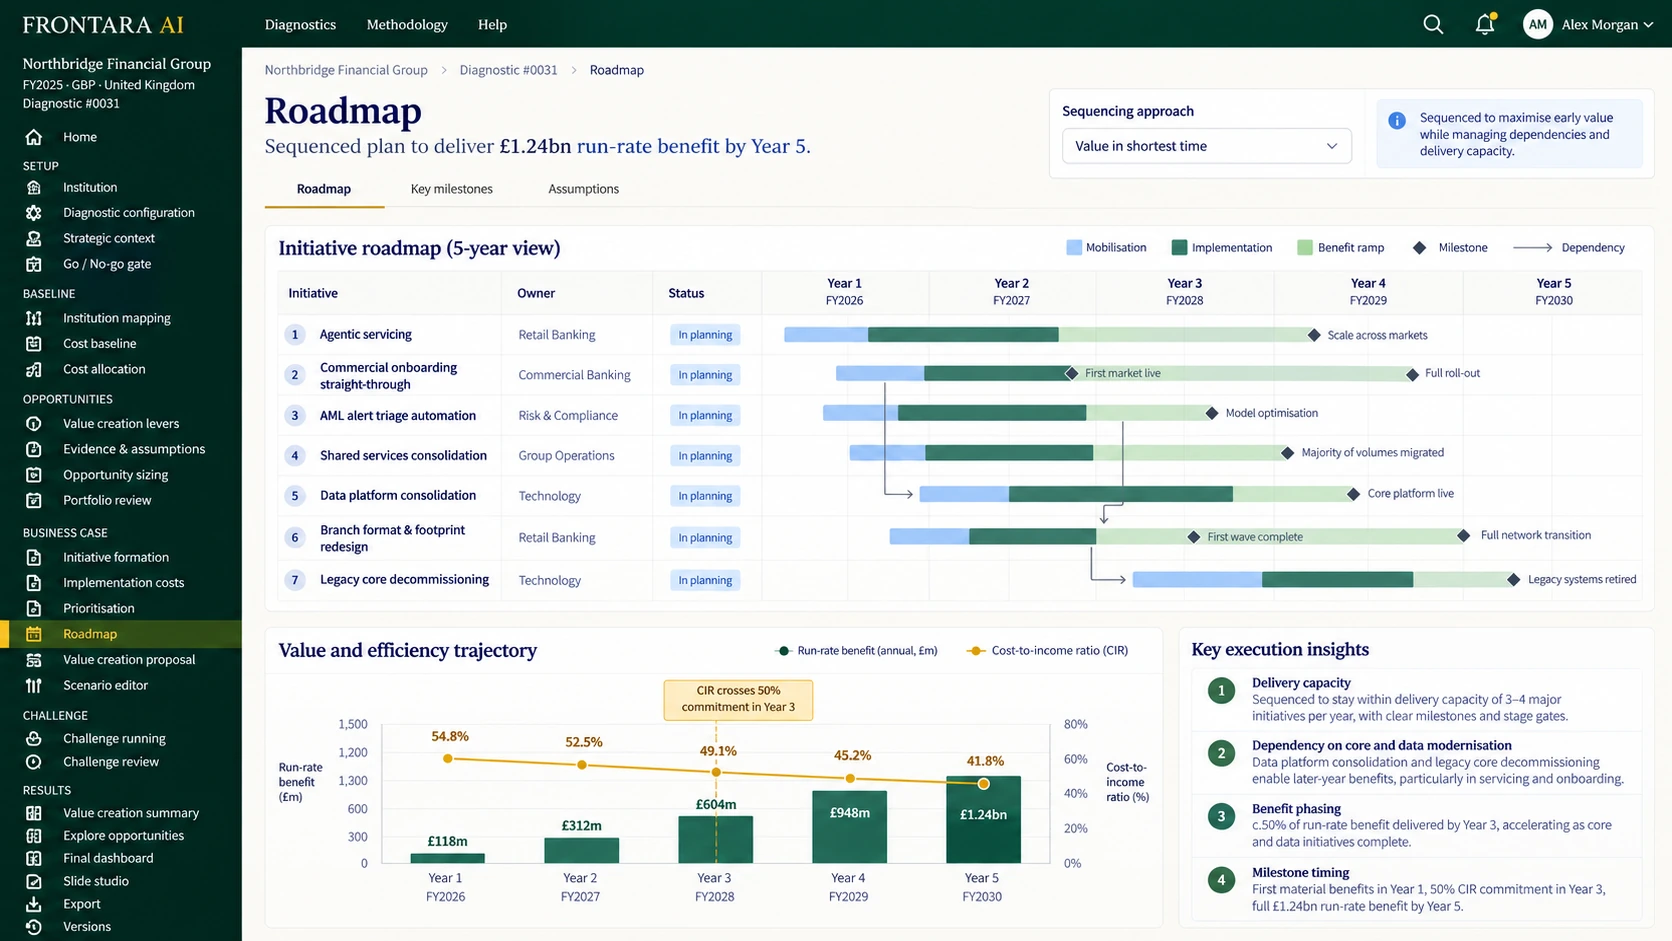
Sequencing is a judgement, not an output. The user chooses the logic — value in shortest time, biggest bets first, lower risk, or capital efficiency — and Frontara recalculates the recommended order against it.
From there it plots delivery across a five-year horizon with dependencies, phases and milestones, and models benefit from three months after each go-live rather than at launch. The cost-to-income trajectory moves with the sequence, so the effect of a different choice is visible immediately.
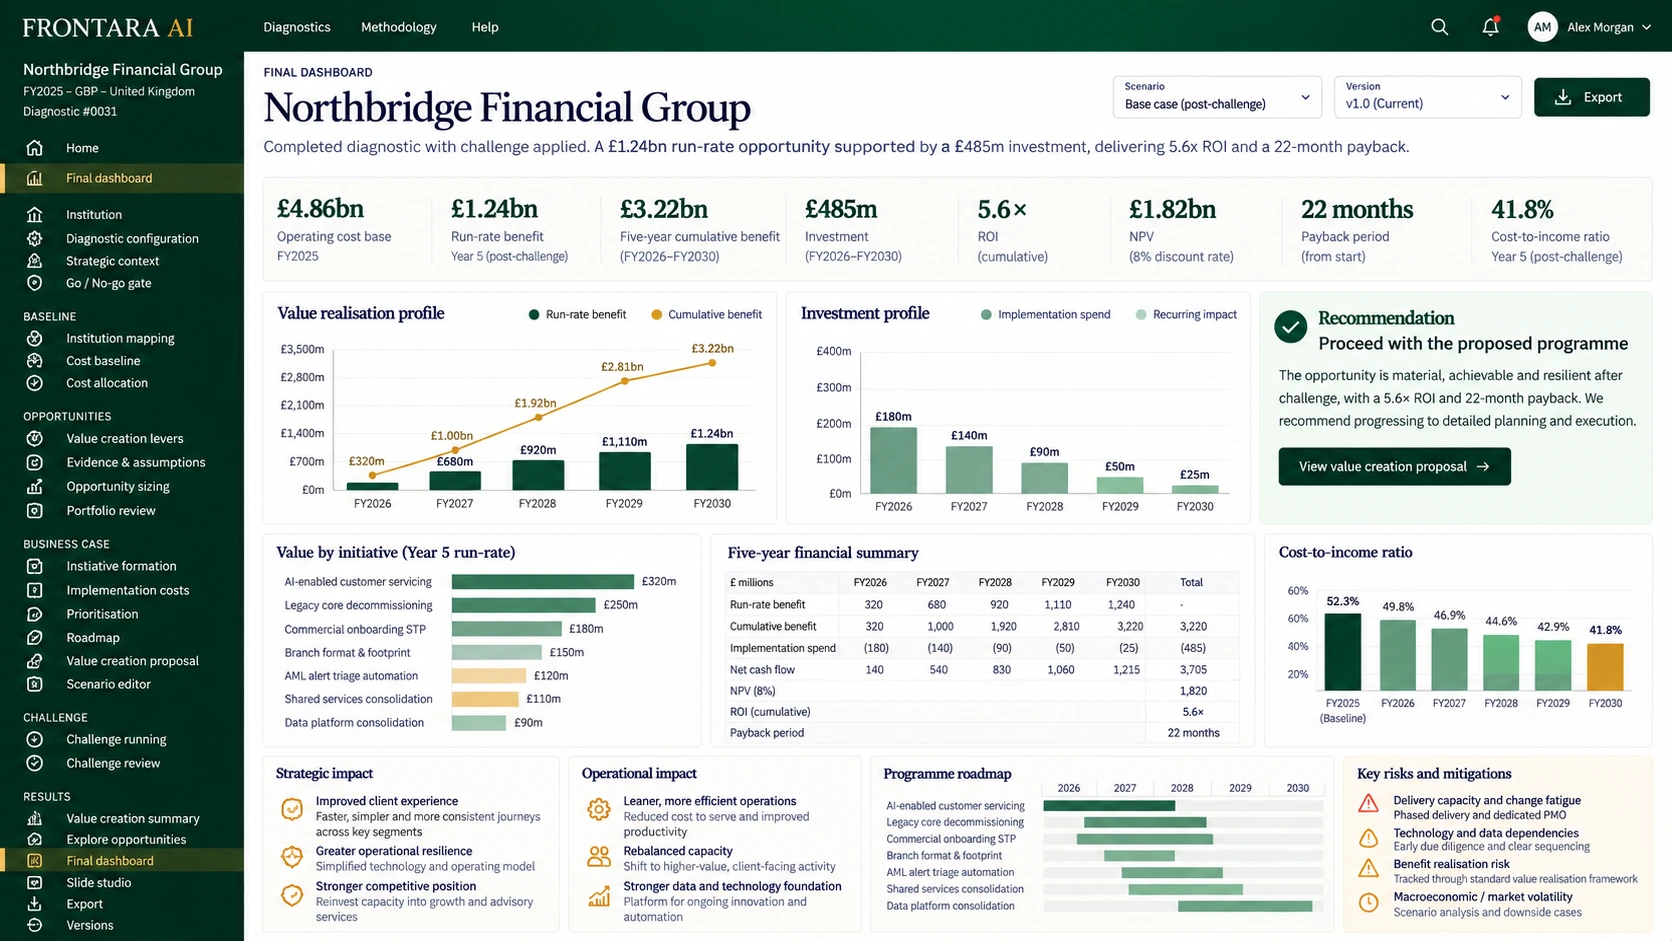
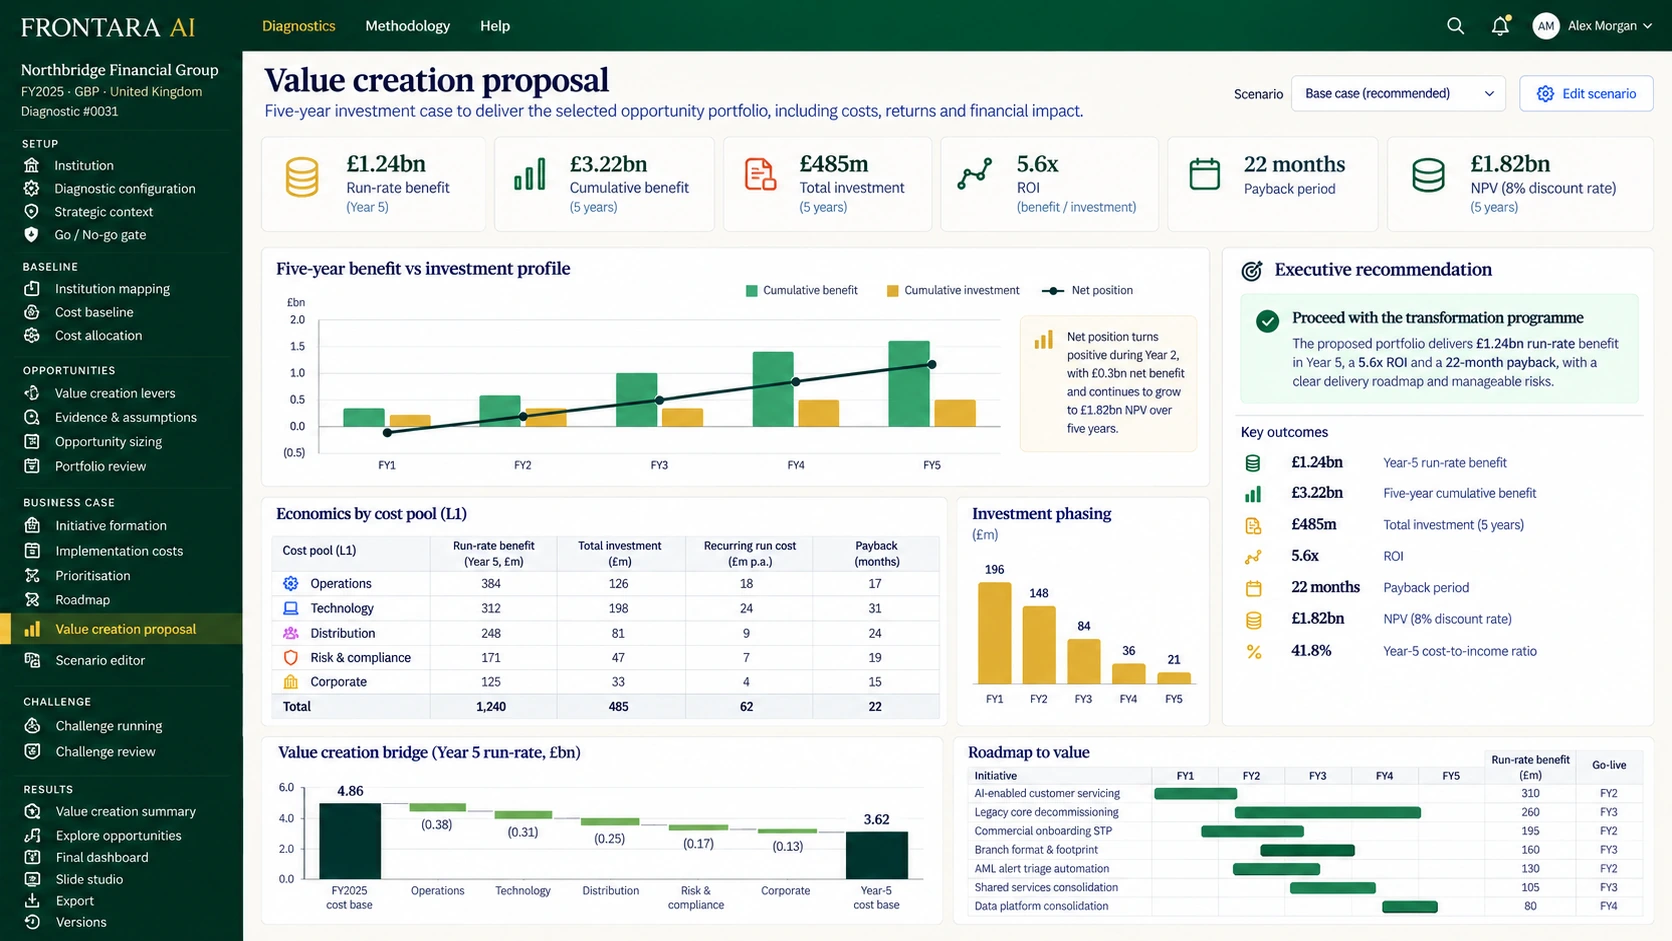
Benefit, cost and timing become one case.
A saving is not a business case. Frontara sizes implementation and recurring run cost against the benefit each initiative enables, by cost pool and by year, then assembles the five-year position: run-rate benefit, cumulative benefit, investment, ROI, NPV, payback and the resulting cost-to-income ratio.
Everything recalculates the moment an assumption, an initiative or the sequence changes, so the trade-off between ambition and investment can be tested rather than argued.
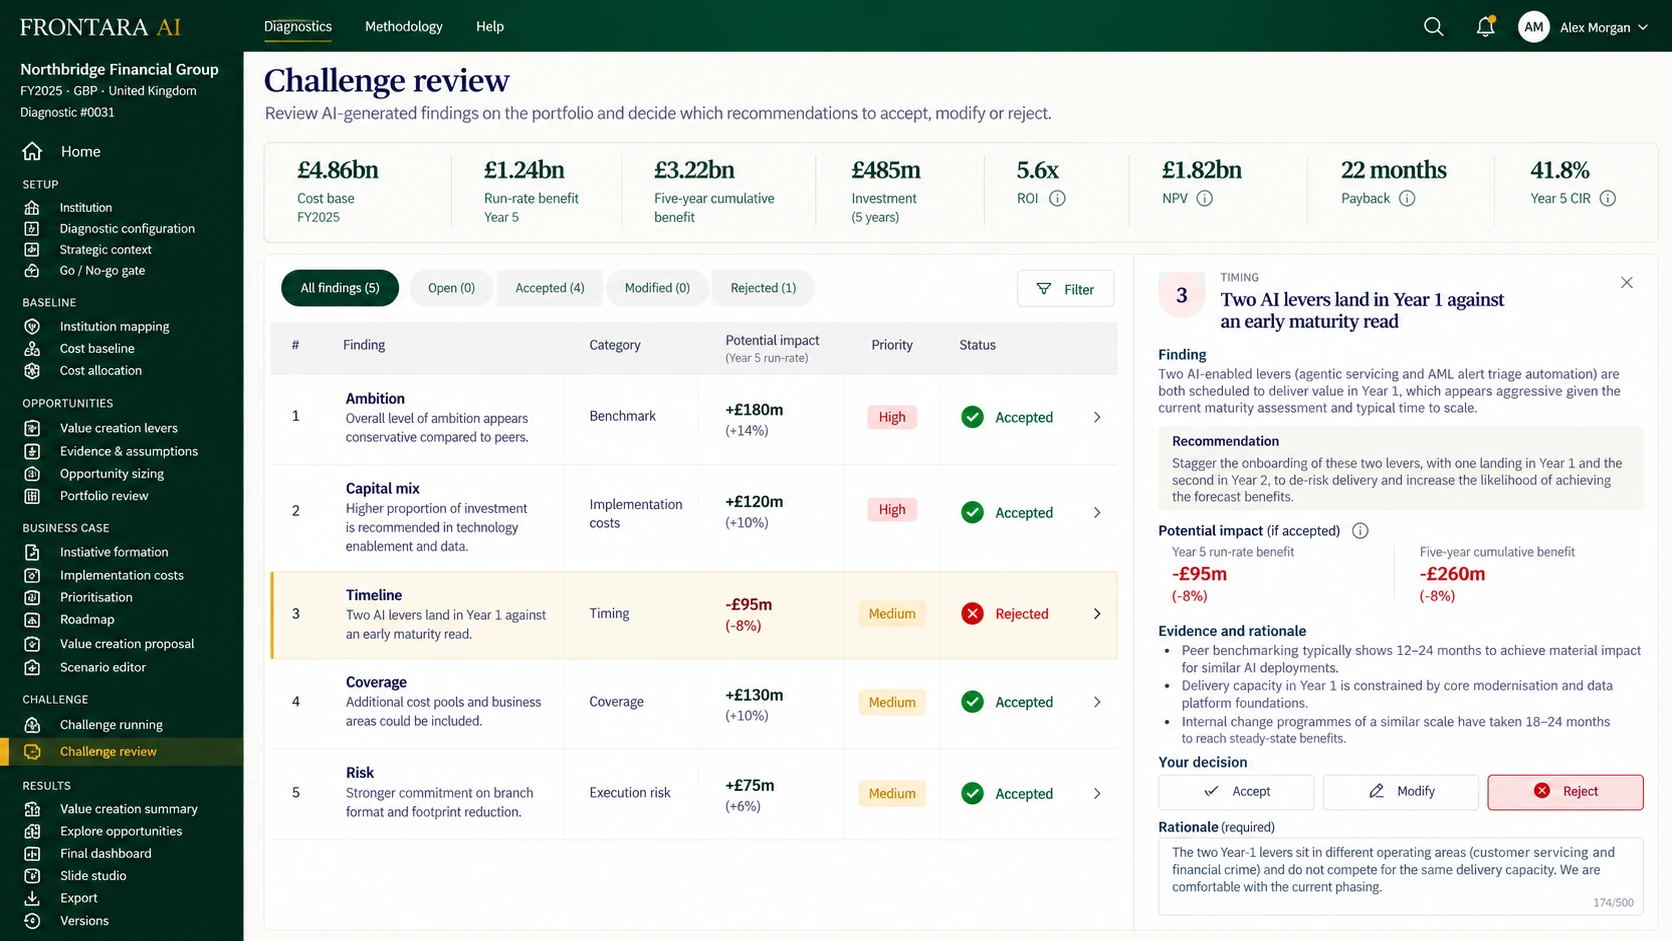
Frontara argues against its own case.
Before the proposal is finalised, Frontara switches sides and reads it as the client sponsor would — testing ambition, the balance of investment, delivery timelines, coverage gaps and any conflict with the commitments captured in stage one.
Each finding arrives with the evidence behind it and its quantified impact on the case, and stays open until the user accepts, modifies or rejects it. Nothing changes in the model until that decision is made, and the decision is recorded against the version.
The output you actually present.
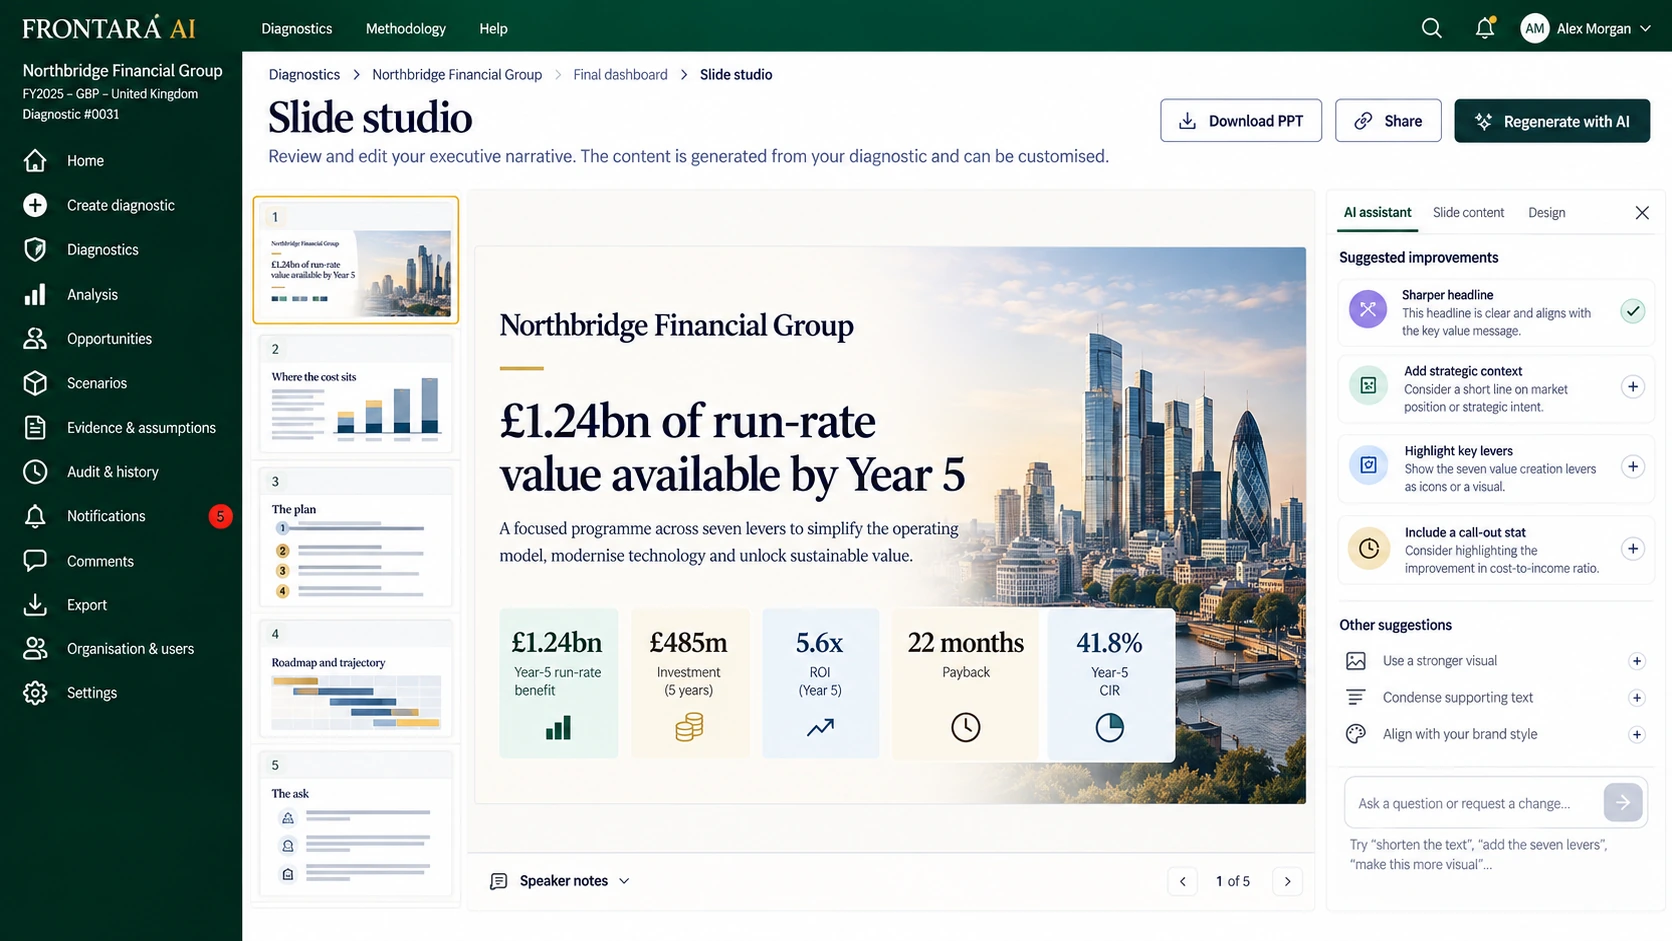
The finalised diagnostic becomes an editable executive narrative with action-titled headings, drawn from the model rather than retyped from it — delivered editable, not as a PDF.
Changes to wording and presentation do not silently change the underlying numbers. A change that would move the model routes back to the diagnostic, so the deck and the case cannot drift apart.
What a run like this cannot tell you.
Every diagnostic ends with its own limitations recorded, not a general disclaimer — the specific points where internal data would move the answer most. Typically that means contract terms behind a decommissioning case, how a cost is allocated internally, benefit already booked against an undisclosed programme, and whether the organisation can absorb the delivery load in a given year.
Frontara sizes the prize and shows you where to look. Validating it against internal data is the step that follows — not one we pretend to have skipped. How the evidence works.
See what Frontara could uncover.
Tell us what you want to diagnose. We'll show you the platform, understand your objectives and discuss the scope and timing of your diagnostic.
diagnostics for financial services.